

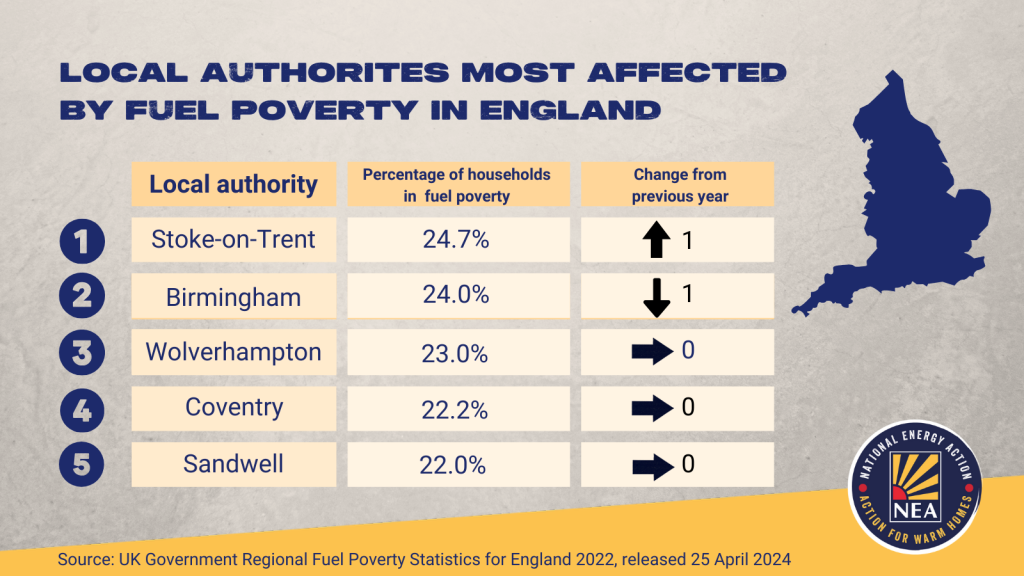
- New government figures on regional fuel poverty in England find Stoke-on-Trent has the highest percentage of households living in fuel poverty (24.7%), replacing Birmingham.
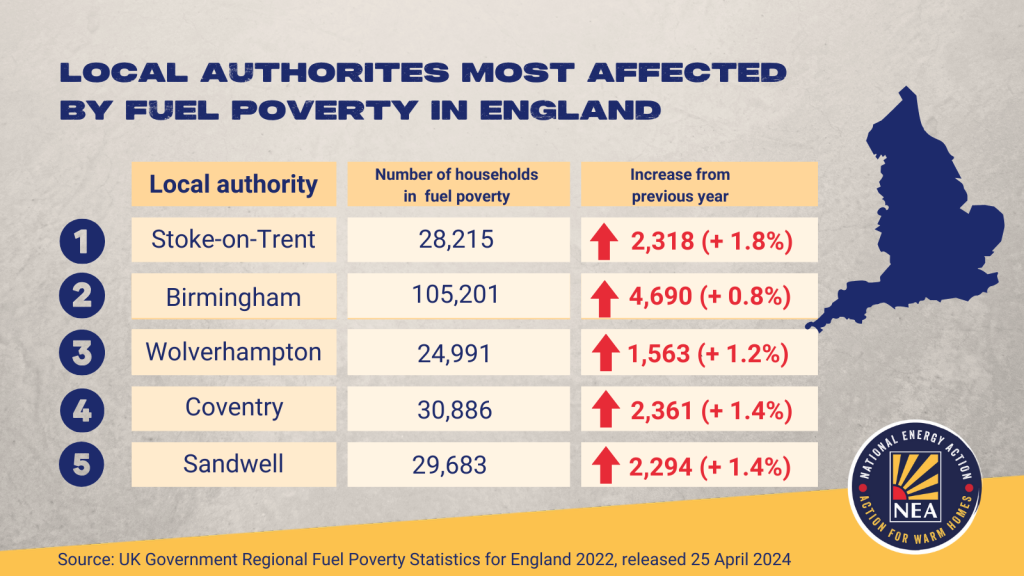
- Birmingham is second for proportion but remains the city with the highest total number of households in fuel poverty, with 105,201.
- Wolverhampton, Coventry and Sandwell also have high percentages of fuel poverty.
- Fuel poverty charity National Energy Action highlights the two-year time lag in the data and limitations in how it has been measured.
Today, the UK government releases new data showing the levels of fuel poverty regionally in England in 2022. New analysis by fuel poverty charity National Energy Action (NEA) reveals Stoke-on-Trent has the greatest proportion of households living in fuel poverty at 24.7%, replacing Birmingham in the top spot. Birmingham still has the highest total number of households living in fuel poverty with 105,201 living under the poverty line in a cold home; an increase of 0.8%. All five local authorities are in the West Midlands.
The data is released today but has a time lag of almost two years. In the winter of 2022-23 the annual energy bill peaked at £2,500 for the typical household, but the true impact of the cost was cushioned by the government’s Energy Bills Support Scheme, which gave households £400.
Adam Scorer, chief executive of National Energy Action says:
‘Nowhere wants to be at the top of this league table. This data shows how fuel poverty hits different parts of England harder – areas with the lowest incomes and draughtiest homes.
‘Winter 2022-23 was, we hope, the peak of the energy crisis. but this doesn’t mean the government can consider the crisis over. Bills remain far higher than pre-crisis levels. Households remain dangerously exposed to volatile wholesale energy prices because of how draughty our homes are and how weak household finances have become. Energy debt has reached record levels.
‘The government has much to do to make sure fuel poverty of this scale does not remain a fact of life. A social tariff would protect those on the lowest incomes going forward, a ‘help to repay’ debt scheme would lift people out of a downward spiral, and large-scale investment in energy efficiency would make homes warm and cheaper to heat in the long-term.’
There are also limitations with how the data is calculated. It is based on the Low Income Low Energy Efficiency (LILEE) indicator, which takes into account household income, energy requirements and fuel prices but there are limitations with this definition. Those in homes with an EPC rating of C or above are not counted as fuel poor no matter their income or energy costs.
The number of households in fuel poverty across the five worst affected local authorities totals 218,976, an increase of 13,226.
National Energy Action has updated its fuel poverty map so householders can find out how their area compares. Go to https://www.nea.org.uk/fuel-poverty-map/.
ENDS
Notes to editors
- National Energy Action (NEA), is the national fuel poverty charity, working across England, Wales and Northern Ireland, to improve the lives of people in fuel poverty. We directly support people with energy and income maximisation advice, and we advocate on issues such as the current energy crisis and the need to improve the energy efficiency of our homes. See: https://www.nea.org.uk/
- Today’s data is measured according to the Low Income Low Energy Efficiency (LILEE) indicator. This takes into account household income, energy requirements and fuel prices but there are limitations with this definition. Those in homes with an EPC rating of C or above are not counted as fuel poor no matter their income or energy costs. Those most impacted by fuel poverty include people in privately rented homes, older, less energy efficient properties. People under 24 and those from ethnic minority backgrounds and in the lowest income decile are also disproportionately affected.
- The definition of fuel poverty that National Energy Action uses is that a household is in fuel poverty if it needs to spend 10% or more of its income on energy in order to maintain a satisfactory heating regime.
- The government data can be found here: https://www.gov.uk/government/statistics/sub-regional-fuel-poverty-data-2024-2022-data
- Go to https://www.nea.org.uk/fuel-poverty-map/ for the map.
- Our fuel poverty explainer, https://www.nea.org.uk/news/fuel-poverty-explainer, shows the limitations of the government data.
- Last year’s regional fuel poverty data can be found here: https://www.gov.uk/government/statistics/annual-fuel-poverty-statistics-report-2024
| Number of households | Number of households in fuel poverty | Proportion of households fuel poor (%) | Old ranking | |
| Stoke-on-Trent | 114,360 | 28,215 (+2318) | 24.7 (+1.8%) | 2 |
| Birmingham | 438,509 | 105,201 (+4690) | 24.0 ( +0.8%) | 1 |
| Wolverhampton | 108,855 | 24,991 (+1563) | 23.0 (+1.2%) | 3 |
| Coventry | 138,897 | 30,886 (+2361) | 22.2 (+1.4%) | 4 |
| Sandwell | 134,723 | 29,683 (2294) | 22.0 (+1.4%) | 5 |